In the finite element analysis, the result always has a range. Whether it is the deformation, strain, stress in structural analysis, the temperature in thermal analysis, the pressure and velocity in fluids, or the voltage and field strength in electromagnetic analysis, there will be a range between maximum and minimum values. By default, the finite element analysis software will use the calculated maximum and minimum values as a reference for the contour and display corresponding colors on the bodies.

In general, the maximum and minimum values calculated at the current load step are the upper and lower limits of the contour. Sometimes in order to more clearly show the distribution of some local areas, it is necessary to manually specify fixed maximum and minimum values for the result contour. Sometimes, for time history analysis, the maximum and minimum values are different at each time step. In order to unify the upper and lower limits of the value through the entire time history, a uniform set of maximum and minimum values will be specified.
In the general-purpose finite element software WELSIM, you can easily set the maximum and minimum values for results.
1) When solve is completed and the results are displayed. Right-click on the result legend to pop up the result display context menu.
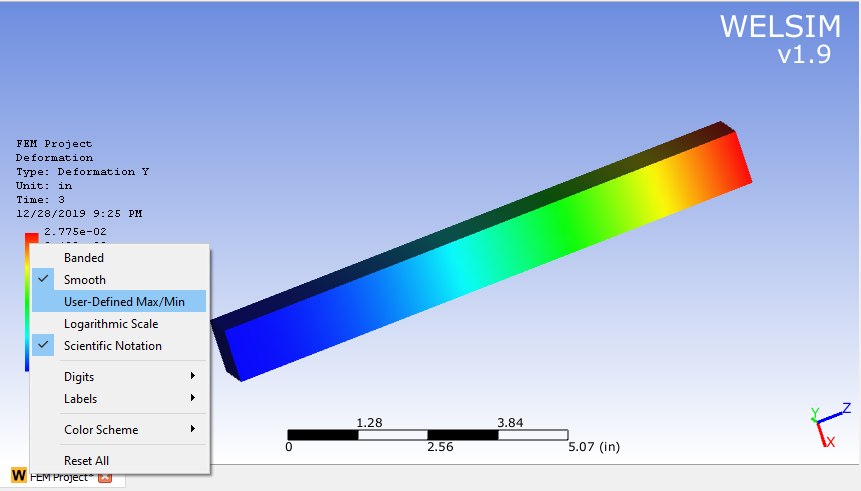
2) Toggle “User-Defined Max / Min” to activate the manual max/min result values and set the maximum and minimum values.

3) After inputting values and clicking OK. The result contour and legend markers automatically updated.
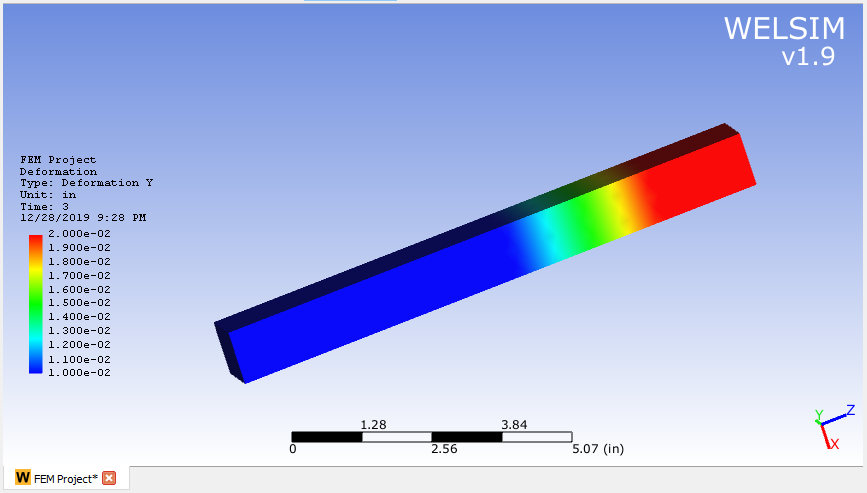
You can see that the contour display above is different from the first one.
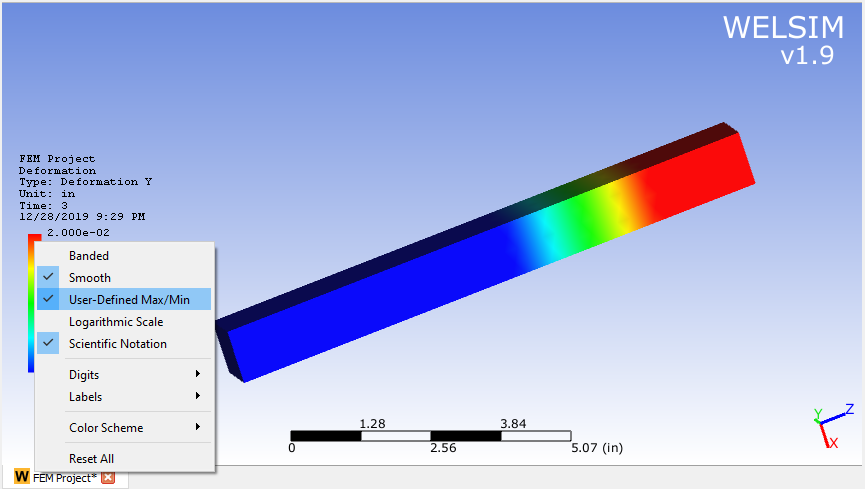
If you want to revert the max/min settings, just right-click on the result legend again and toggle off the “User-Defined Max / Min”.
Note that modifying the maximum and minimum values of the legend bar does not change the analysis result. The contour display still represents the actual finite element analysis calculations. The changed contour display pattern is only due to the modified upper and lower limits on the legend.
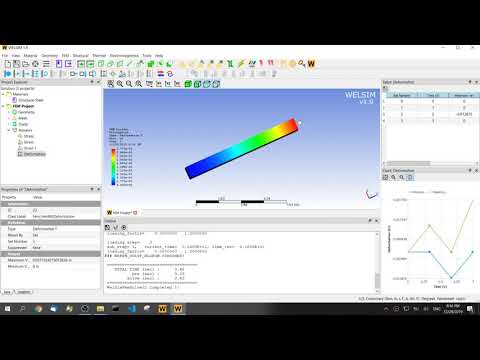
For your reference, a detailed video is attached below.